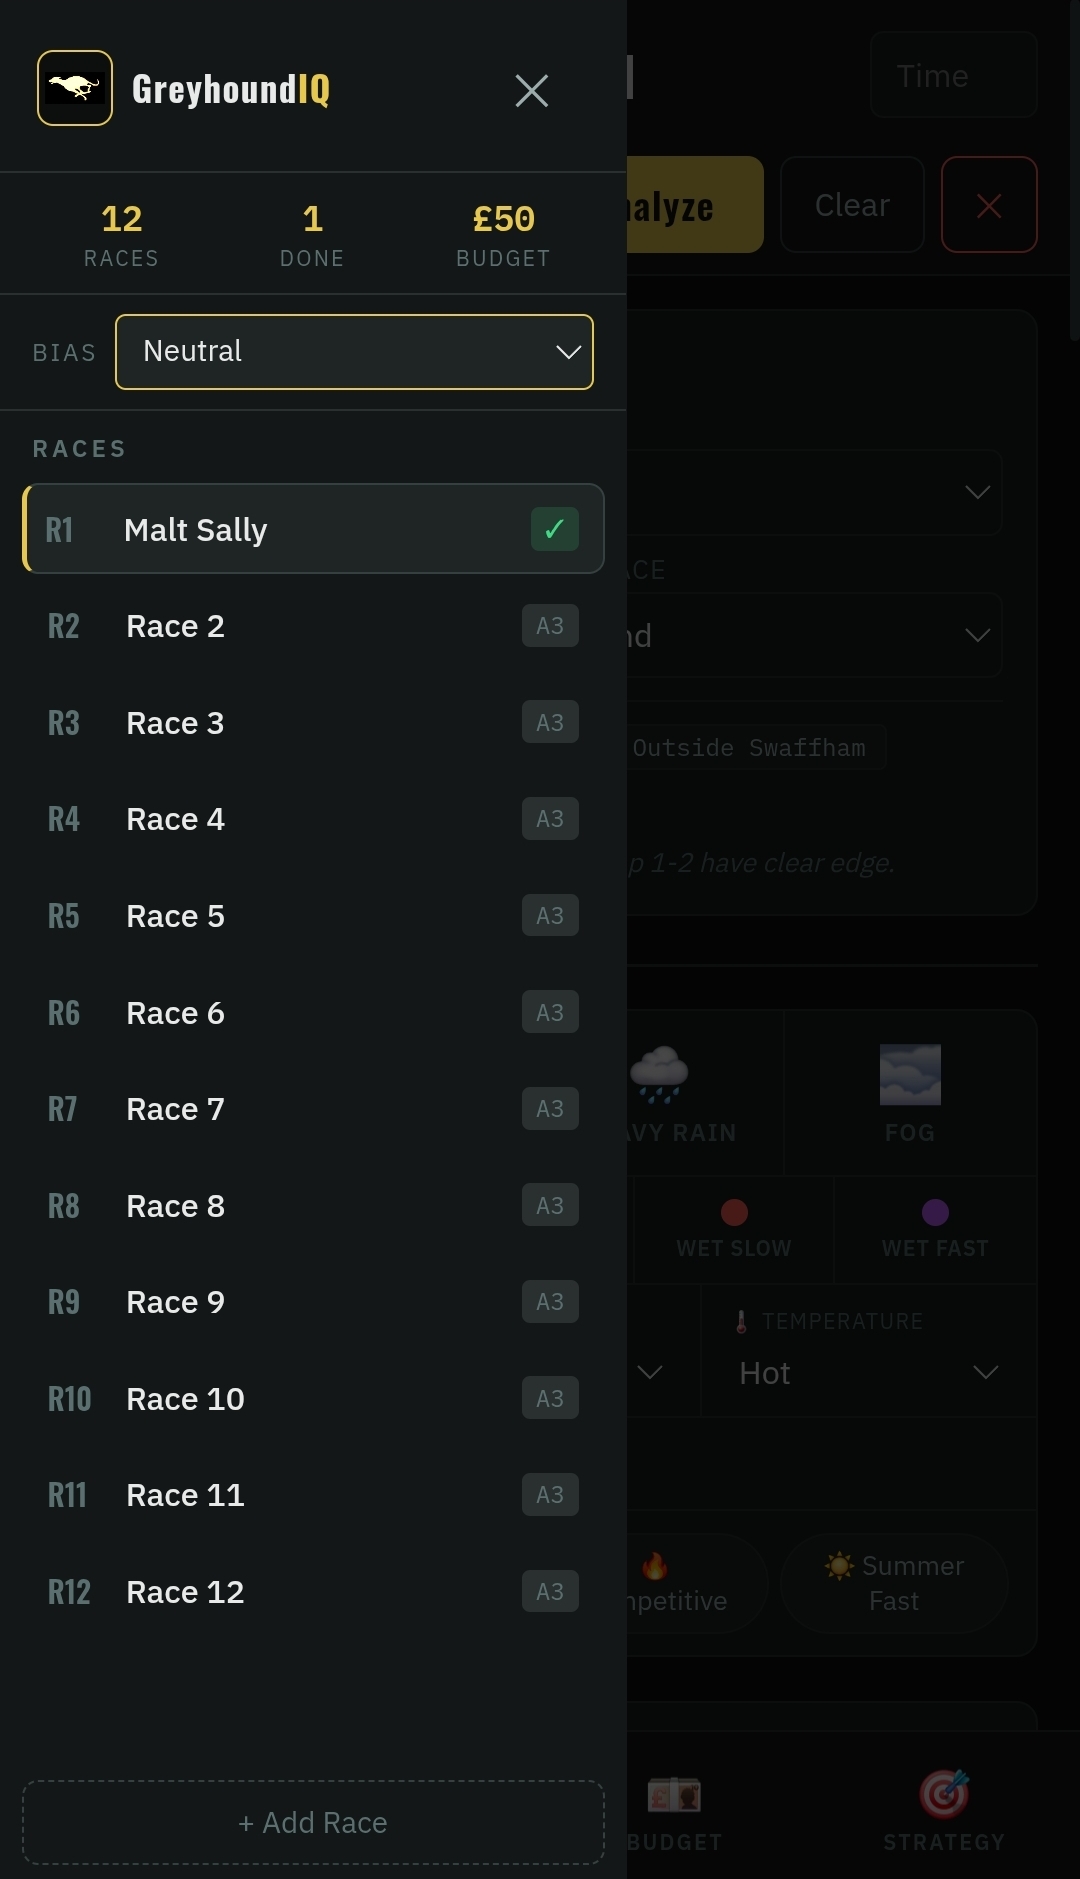
From race card to race score in under a minute — here’s exactly what happens inside the app.
The workflow below is the same whether you’re stood at the rail with your phone or sat at a desk with a full card open. Only the input method changes: camera at the track, screenshot at home.
Step 1 — Scan the Race Card
Open GreyhoundIQ and tap scan.
At the track, point your phone camera at the race card in your betting app or on the printed card. At a desk, screenshot the race card from any betting site and upload it — the AI vision engine reads both equally well.
All six dogs populate automatically: trap number, recent run times, finishing positions, grade history, and remarks. No typing, no copy-pasting, no manual entry. This is the step that makes the ninety-second workflow possible.
Step 2 — Scan the Early Odds
Scan the odds board or the price list from your betting app. GreyhoundIQ records the opening prices, which becomes the baseline for drift and steam detection later.
If you’re analysing well ahead of the race, this step gives the market engine something to measure against. Skip it and you still get full form analysis — you just lose the market movement layer.
Step 3 — Set the Conditions
Before the scores calculate, tell the app what you’re racing in:
Weather — dry, light rain, heavy rain, or fog
Going — fast, good, slow, wet slow, or wet fast
Grade — the race grade, A1 through A9, or open
Time of day — morning, afternoon, evening, or night
The conditions engine then adjusts every dog’s score based on how these factors historically affect different running styles. It takes about ten seconds and materially changes the output.
Step 4 — Analyse
Select your bet type — straight tricast, forecast, or win — and hit analyse.
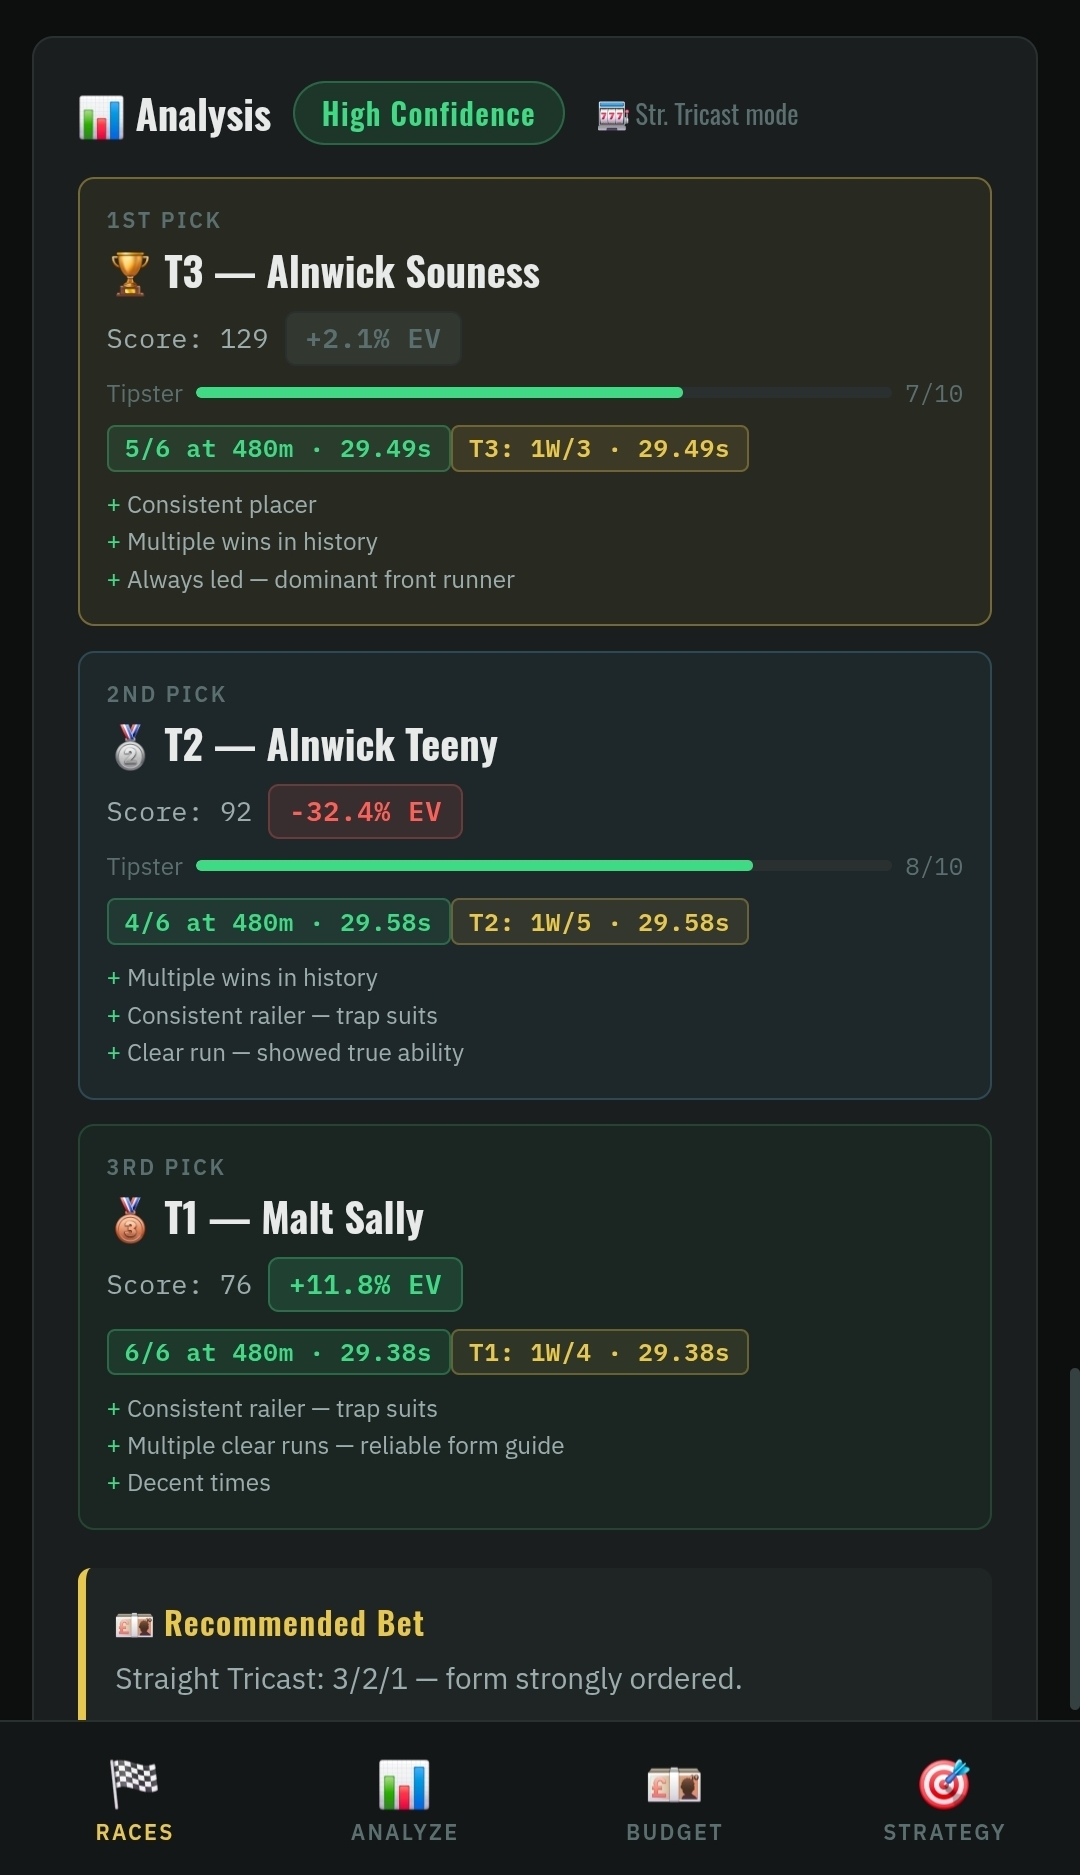
Every dog now carries a confidence score reflecting its overall case for this race, in these conditions, from this trap. The scores are comparative rather than absolute: a dog scoring 74 isn’t guaranteed to win, but it has a materially stronger case than one scoring 38.
The SP value calculator sits alongside, comparing each score-implied probability against the live market price and flagging where you’re getting genuine value versus where the price is short.
On desktop, all of this appears on one screen. On mobile, it’s arranged for thumb scrolling with the headline scores first.
Step 5 — Re-scan Before the Off
Around three minutes before the race, scan the odds again and re-analyse.
This is where drift and steam detection does its work. A dog shortening steadily suggests informed money arriving. A dog drifting suggests the opposite. When a steamer also carries a strong form score, that convergence is a meaningful signal. When the two diverge, it’s worth understanding why before committing.
This second scan is the single highest-value step in the workflow, and it’s the reason the app was built to run fast on a phone.
On Desktop, You See More
Everything above works identically on a laptop or desktop — but the experience is genuinely different.
The full analysis grid fits on one screen with no scrolling. You can see each dog’s individual signal breakdown alongside the final score, which makes it far easier to understand why the engine ranked the field the way it did rather than just accepting the output.
For anyone working through a full evening card, this is the better setup. Screenshot each race’s analysis, note the actual result afterwards, and over twenty or thirty races you’ll build a clear picture of where the engine is strongest and where you should apply your own judgement.